
Dogecoin price failed to make the most of Elon Musk’s latest endorsement, rising marginally on news of his support before slipping up.
DOGE rises then falls following Musk’s statement
Following Elon Musk’s reference to it as “the people’s cryptocurrency”, DOGE moved strongly upwards, when the rest of the cryptocurrency market was consolidating.
At the time of writing, the DOGE/USD pair had lost its short-lived gains following Musk’s statement and was 2.77% lower than its position 24 hours earlier. Nonetheless, Dogecon continues to hold on to its position as the ninth-most valuable crypto asset, by market capitalization.
Elon Musk the tie-breaker?
Dogecoin could have gained from Elon Musk’s “negative” sentiment regarding DOGE’s defacto rival, Shiba Inu. For a long time, there has been widespread perception that the world’s richest man holds SHIB coin. However, he has now cleared the doubts. Some investors who have been weighing their options on which way to go between the two canine coins could have been swayed by Musk’s statement to put their money on DOGE.
Technical analysis for DOGE coin price
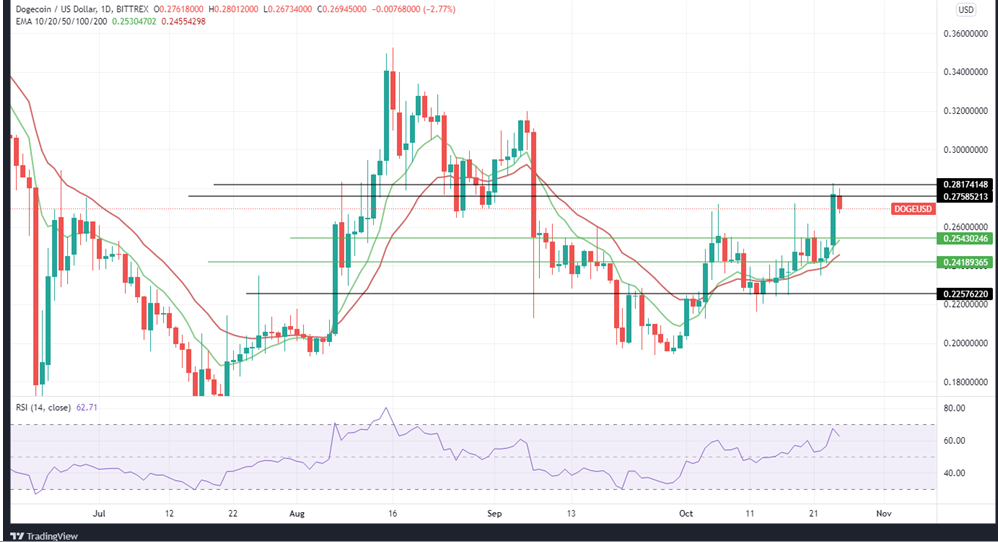
DOGE/USD has formed a bullish rectangle and the recent uptrend looks more likely to continue. The RSI is currently at 62, which signals a strong momentum. In addition, the 10-EMA is well above the 20-EMA, which strengthens bullish assertions. With this in mind, sustained momentum could push the price up to $0.27585 where the DOGE/USD pair could encounter the first resistance. If the price breaks beyond that point, the second resistance is likely to come at $0.28174.
The greatest concern for the bulls should be the possibility of a weakened market momentum. If the momentum weakens, it could trigger bearishness. With the bears in control, the price could slip down to the first support at $0.25430 and the second support at $0.24184. Beyond that point, further bearishness could drive the price down to $0.22576.