

The BP share price is in a tight range even as natural gas and crude oil prices have surged recently. The stock is trading at 303p, which is about 20% above where it started this year. In the same period, the Royal Dutch Shell share price has jumped by about 16%.
BP has lagged other supermajors
BP is a leading oil supermajor with operations around the world. The company has a market capitalization of more than 60 billion pounds, making it relatively smaller than other companies like BP, Chevron, and ExxonMobil.
Like all companies in the sector, BP has benefited from stable crude oil and natural gas prices. Oil prices have jumped by more than 40% this year while natural gas is sitting at the highest level in years. However, like Shell, its stock has lagged the performance of oil and other supermajors. Indeed, the Vanguard Energy ETF has risen by more than 40% this year.
This underperformance is mostly because there are questions about the company’s investments in clean energy. The company has boosted its investments in electric car charging systems and other clean energy systems. It aims to become net-zero by 2050.
The BP share price has lagged even as the company’s fundamentals have improved. For example, the company has managed to reduce its debt ahead of schedule. As a result, it has committed to boost its dividends and other returns to shareholders. Also, crude oil prices remain stubbornly high, and analysts at Bank of America believe that they will rise to $100 in the near term.
At the same time, BP has a relatively high and stable dividend. It has a dividend yield of about 5%, which is higher than the average of the S&P 500. It also has a PE ratio of about 6, making it cheaper than ExxonMobil, Chevron, and TotalEnergies have a PE of more than 8.
BP share price forecast
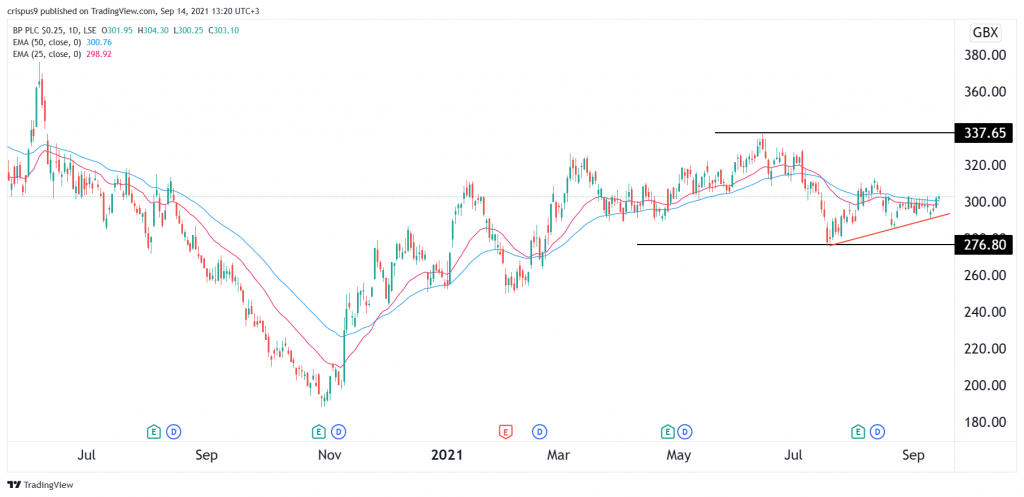
The daily chart shows that the BP stock price has been in a tight range recently. It is trading at 303p, which is between the key support and resistance levels at 276p and 337p. The shares are along the 25-day and 50-day moving averages. It is also slightly above the short ascending trendline shown in red.
Nonetheless, it has formed a head and shoulders pattern, which is usually a bearish sign. Therefore, while fundamentals are favorable, the stock will likely break out lower in the near term. If this happens, the key level to watch will be at 276p.