
The IAG share price has been struggling to get back to its feet for the past two months. The Anglo Spanish multinational airline holding company is trading 1.73% lower at 170.44p.
IAG Struggles
Just like EasyJet and Ryanair, International Consolidated Airlines Group (LON: IAG), has been struggling to recover its losses. The airlines improved this year but are not yet close to their pre-pandemic levels. Analysts expect the companies to post significant increases by the end of this year.
However, with the resurgence of the Covid-19 virus alongside the Delta variant, the growth is likely to slow down for the rest of the year. The British Airway parent recently outlined its cautious plans to return more planes to the skies after a difficult first half of the year.
According to data published by IAG on July 30, 2021, the company’s losses for the first half of the year spiraled to €2 billion. IAG share price declined after the company reported an operating loss of €976 million in the second quarter. However, this was better than the €4.4 billion loss in the first half of 2020.
IAG outlined its plans to raise its passenger capacity in the third quarter up 45% of 2019 pre-pandemic levels. This will also be 20% more than the first half of the year. IAG is likely to take the most time recovering from its losses.
IAG Share Price Stance
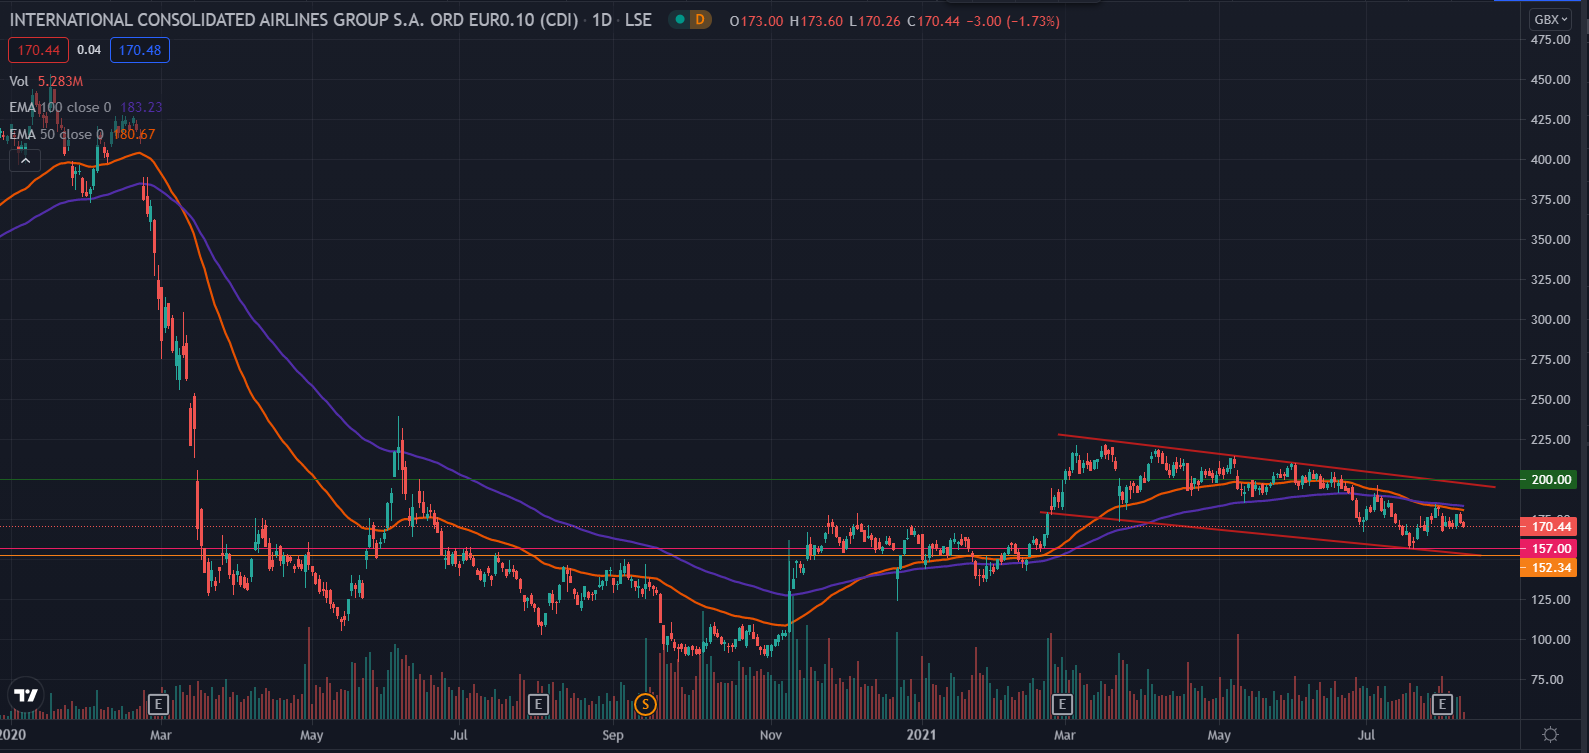
The IAG share price has been trading around 23% below its highest point in March. It has formed a bearish descending channel for the past seven months. It hit an intraday high of 173.60 before pulling back.
On the daily chart, it is trading below the 50 and 100-day exponential moving averages. With the current negative price action, the next target will be at the lower end of the descending channel at 152.34p.
The bearish outlook is staged to extend if the price is below both EMAs. The reference point will be July’s low at 157p. However, should the price recover, the next target would be the resistance level at 200p.
IAG Price Chart