
The Rolls Royce share price has been under intense pressure, dropping more than 6%. However, the RR stock has jumped more than 30% from its lowest point this year. The resurgence of the coronavirus alongside the Delta variant continues to weigh heavily on the aviation sector. Rolls Royce Holdings Plc has a total market capitalization of £9.45 billion.
RR Is Declining
Rolls Royce Holdings Plc is a British multinational aerospace and defense company launched in 2011. Rolls Royce is the second-largest aircraft engine manufacturing company.
The company grew from the electrical and mechanical business started by Henry Royce in 1884. It makes most of its money from selling airplane engines. The company is well known for its famous Trent 100 engine used in Boeing 787.
RR has been among the biggest corporate losers from the coronavirus pandemic. The collapse in long-haul air travel halted the operations of the aero-engine maker, slashing its revenues.
Nevertheless, the company returned to profitability in the first half of the year. The company reported an operating profit of £370 million, up from a £160 million loss in the previous year. It also recorded a strong liquidity position with no maturities before 2024.
However, just like most aerospace companies, huge debts taken in 2020 remain a big challenge for the companies.
Rolls Royce Share Price Analysis
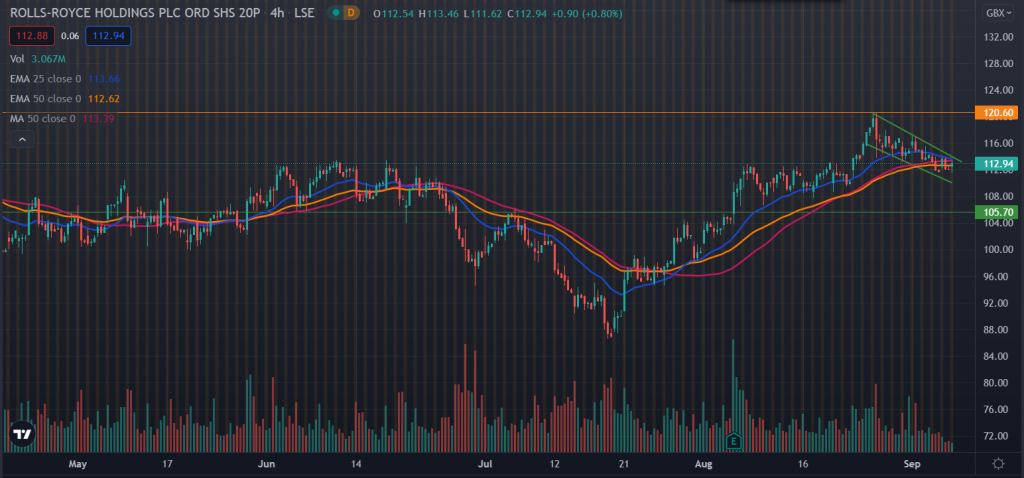
The four-hour chart shows that the Rolls Royce share price has been struggling to recover. It has formed a descending channel which is usually used as a bullish indicator. At the time of writing, it was trading 0.80% higher at 112.94p.
It is trading along the 50-day exponential moving average. It is also trading slightly below the 25-day EMA and 50-day moving average.
Therefore, the RR stock is likely to continue edging lower before bouncing back. If this happens, the next logical target will be the resistance at 120.60p. On the flip side, a move below the key support at 105.70 will invalidate this view.
RR Price Chart